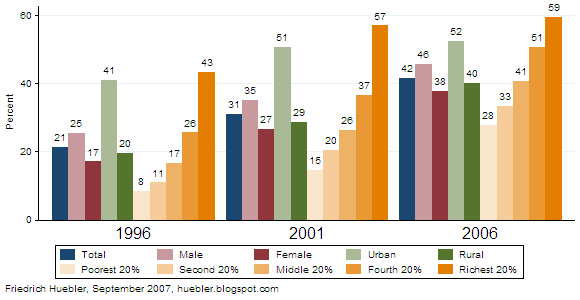
India is the country with the largest number of children out of school. India has more children of school age than China and at the same time relatively low attendance rates, in spite of recent increases in primary and secondary school participation.
Newly released data from a Demographic and Health Survey (DHS) show that the primary school attendance rate has increased by more than one percentage point annually since the beginning of the decade. In 2000, 76 percent of all children of primary school age (6-10 years) were in school. By 2006, this value had increased to 83 percent (see Table 1). The attendance rate of girls increased by 9 percent over the 2000-2006 period and the attendance rate of boys by 6 percent. School attendance rates also grew in urban and rural areas, and across all household wealth quintiles. However, close to 17 percent of all children of primary school age continue to be out of school.
Table 1: Children of primary school age in school (percent), India 2000 and 2006
Data sources: India Multiple Indicator Cluster Survey (MICS) 2000, India DHS 2005-06.
As a result of the increase in primary school attendance, the number of children out of school fell by almost one third from 30 million in 2000 to 21 million in 2006 (see Table 2). This pattern could be observed for boys and girls, and for residents of urban and rural areas. However, disaggregation by household wealth reveals that one group of children did not follow the nationwide trend. Among the poorest 20 percent of all households, the number of children out of school grew from 9.4 million in 2000 to 9.8 million in 2006. Although the primary school net attendance rate among children from the poorest households grew by 3 percentage points from 2000 to 2006 (see Table 1), this increase was not strong enough to keep pace with population growth in the poorest segment of the Indian population.
Table 2: Children of primary school age out of school (million), India 2000 and 2006
Data sources: India MICS 2000, India DHS 2005-06.
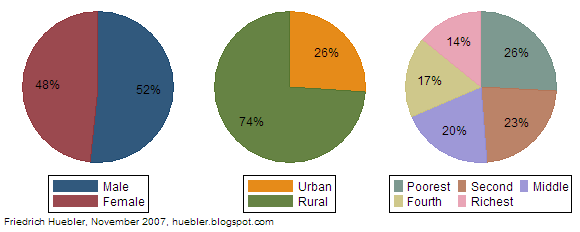
A comparison of the composition of the total population of primary school age and the population of children out of school shows which group of children are disproportionately more likely to miss out on education. Figure 1 shows the composition of the Indian population aged 6 to 10 years. 52 percent of all children in this age group are boys and 48 percent are girls. About one quarter of all children of primary school age live in urban areas and the remaining three quarters in rural areas.
Wealth quintiles are constructed by ranking the entire population of India, regardless of age, according to household wealth and dividing them into five equally sized groups with 20 percent each of the total population. As Figure 1 shows, households from poorer quintiles are more likely to have children than households from richer quintiles. Overall, 26 percent of all children between 6 and 10 years live in the bottom quintile and a further 23 percent in the second quintile.
Figure 1: Population of primary school age by sex, area of residence, and wealth quintile, India 2006
Data source: India Demographic and Health Survey 2005-06.
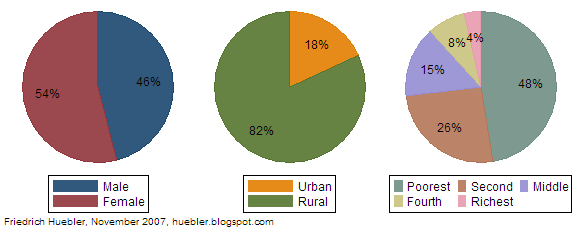
Figure 2: Children of primary school age out of school by sex, area of residence, and wealth quintile, India 2006
Data source: India Demographic and Health Survey 2005-06.
Figure 2 shows the composition of the group of children aged 6 to 10 years that are out of school. Although girls only account for 48 percent of the total number of children in this age group, they make up 54 percent of the children out of school. Rural children are disproportionately more likely to be out of school than urban children. Most strikingly, children from the poorest quintile make up almost half of all children out of school. 48 percent - 10 million of the 21 million children out of school - live in the poorest quintile. 74 percent of all children out of school live in the two poorest quintiles.
These numbers emphasize the close link between poverty and school attendance in India. School attendance rates have increased among the poorest households between 2000 and 2006 but the increase was not large enough to keep pace with population growth. Unless India places more emphasis on school attendance among the poor, the country will miss the Millennium Development Goal of universal primary education by 2015.
Related articles
Permanent URL: http://huebler.blogspot.com/2007/11/india-has-21-million-children-out-of.html
Newly released data from a Demographic and Health Survey (DHS) show that the primary school attendance rate has increased by more than one percentage point annually since the beginning of the decade. In 2000, 76 percent of all children of primary school age (6-10 years) were in school. By 2006, this value had increased to 83 percent (see Table 1). The attendance rate of girls increased by 9 percent over the 2000-2006 period and the attendance rate of boys by 6 percent. School attendance rates also grew in urban and rural areas, and across all household wealth quintiles. However, close to 17 percent of all children of primary school age continue to be out of school.
Table 1: Children of primary school age in school (percent), India 2000 and 2006
| 2000 | 2006 | Change 2000 to 2006 | |
| Male | 79.2 | 85.2 | 5.9 |
| Female | 72.3 | 81.4 | 9.1 |
| Urban | 82.5 | 88.5 | 5.9 |
| Rural | 73.8 | 81.5 | 7.7 |
| Poorest 20% | 66.1 | 69.4 | 3.2 |
| Second 20% | 69.2 | 81.2 | 12.1 |
| Middle 20% | 78.8 | 87.5 | 8.7 |
| Fourth 20% | 82.1 | 92.2 | 10.1 |
| Richest 20% | 89.1 | 95.7 | 6.6 |
| Total | 75.9 | 83.3 | 7.5 |
As a result of the increase in primary school attendance, the number of children out of school fell by almost one third from 30 million in 2000 to 21 million in 2006 (see Table 2). This pattern could be observed for boys and girls, and for residents of urban and rural areas. However, disaggregation by household wealth reveals that one group of children did not follow the nationwide trend. Among the poorest 20 percent of all households, the number of children out of school grew from 9.4 million in 2000 to 9.8 million in 2006. Although the primary school net attendance rate among children from the poorest households grew by 3 percentage points from 2000 to 2006 (see Table 1), this increase was not strong enough to keep pace with population growth in the poorest segment of the Indian population.
Table 2: Children of primary school age out of school (million), India 2000 and 2006
| 2000 | 2006 | Change 2000 to 2006 | |
| Male | 13.0 | 9.5 | -3.5 |
| Female | 16.4 | 11.2 | -5.2 |
| Urban | 5.0 | 3.7 | -1.3 |
| Rural | 24.5 | 17.0 | -7.5 |
| Poorest 20% | 9.4 | 9.8 | 0.5 |
| Second 20% | 8.5 | 5.3 | -3.2 |
| Middle 20% | 5.2 | 3.1 | -2.1 |
| Fourth 20% | 4.3 | 1.7 | -2.6 |
| Richest 20% | 2.0 | 0.8 | -1.3 |
| Total | 29.5 | 20.7 | -8.7 |
A comparison of the composition of the total population of primary school age and the population of children out of school shows which group of children are disproportionately more likely to miss out on education. Figure 1 shows the composition of the Indian population aged 6 to 10 years. 52 percent of all children in this age group are boys and 48 percent are girls. About one quarter of all children of primary school age live in urban areas and the remaining three quarters in rural areas.
Wealth quintiles are constructed by ranking the entire population of India, regardless of age, according to household wealth and dividing them into five equally sized groups with 20 percent each of the total population. As Figure 1 shows, households from poorer quintiles are more likely to have children than households from richer quintiles. Overall, 26 percent of all children between 6 and 10 years live in the bottom quintile and a further 23 percent in the second quintile.
Figure 1: Population of primary school age by sex, area of residence, and wealth quintile, India 2006
Data source: India Demographic and Health Survey 2005-06.
Figure 2: Children of primary school age out of school by sex, area of residence, and wealth quintile, India 2006
Data source: India Demographic and Health Survey 2005-06.
Figure 2 shows the composition of the group of children aged 6 to 10 years that are out of school. Although girls only account for 48 percent of the total number of children in this age group, they make up 54 percent of the children out of school. Rural children are disproportionately more likely to be out of school than urban children. Most strikingly, children from the poorest quintile make up almost half of all children out of school. 48 percent - 10 million of the 21 million children out of school - live in the poorest quintile. 74 percent of all children out of school live in the two poorest quintiles.
These numbers emphasize the close link between poverty and school attendance in India. School attendance rates have increased among the poorest households between 2000 and 2006 but the increase was not large enough to keep pace with population growth. Unless India places more emphasis on school attendance among the poor, the country will miss the Millennium Development Goal of universal primary education by 2015.
Related articles
- Primary school attendance by state in India
- 115 million children out of school
- Primary school attendance in India in 2006
- Educational attainment in India, 1950-2000
- Primary school completion in India, 1950-2000
- Education disparity in South Asia
- Demographic and Health Surveys (DHS)
- Multiple Indicator Cluster Surveys (MICS)
- UN Millennium Development Goals
Permanent URL: http://huebler.blogspot.com/2007/11/india-has-21-million-children-out-of.html
 The UNESCO Institute for Statistics has released the