The relationship between national wealth and years of education can be illustrated with a comparison of national data on school life expectancy (SLE) and gross domestic product (GDP) per capita. The school life expectancy is the average number of years a child of school entrance age is expected to spend in primary, secondary or tertiary education. GDP per capita is the total value of all goods and services produced in a country, divided by its population.
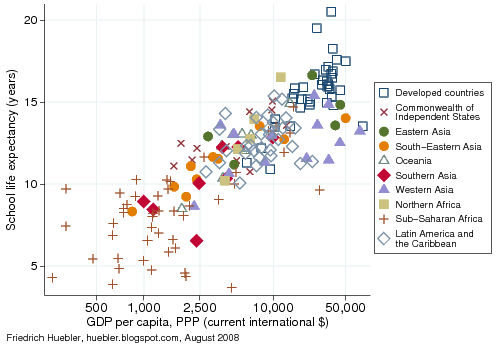
The graph below plots the school life expectancy against GDP per capita in 2006, the year with the most recent data. The GDP data was adjusted with purchasing power parities (PPP) to account for differences in the price levels between countries. To emphasize the shape of the relationship with school life expectancy the GDP data is plotted on a logarithmic scale. In total, data for 175 countries was available. Each country is identified by a marker that indicates the Millennium Development Goal (MDG) region in which it is located.
The graph clearly demonstrates that GDP per capita is positively correlated with school life expectancy. The upper right corner of the graph is populated mainly by developed countries with a high GDP per capita and a long school life expectancy. The countries with the highest school life expectancy are Australia (SLE 20.5 years, GDP per capita $35,500), New Zealand (SLE 19.5 years, GDP per capita $25,500), and Iceland (SLE 18.2 years, GDP per capita $36,900). The countries with the lowest school life expectancy are Angola (SLE 3.7 years, GDP per capita $4,400), Niger (SLE 3.9 years, GDP per capita $630), and the Democratic Republic of the Congo (SLE 4.3 years, GDP per capita $280). The Democratic Republic of the Congo has the lowest GDP per capita of all countries with data.
GDP per capita and school life expectancy, 2006

Data sources: UNESCO Institute for Statistics, World Bank, UN Population Division.
The following table lists the average school life expectancy, the average GDP per capita, and the total population in each MDG region and for the world as a whole. At the global level, the average school life expectancy is 11.5 years and the average GDP per capita is $9,300. Developed countries have the highest school life expectancy (15.8 years) and the highest GDP per capita ($33,500). Countries in Latin America and the Caribbean and members of the Commonwealth of Independent States (the former Soviet Union) also have a high school life expectancy (13.5 years and 13.4 years, respectively) but at lower levels of GDP per capita ($9,100 and $9,400).
In Northern Africa, the average school life expectancy is 12.2 years, with a GDP per capita around $5,400. In Eastern Asia, South-Eastern Asia, Oceania, and Western Asia, the school life expectancy ranges from 11 to 11.4 years. Western Asia, which includes the oil-rich countries of the Middle East, is the region with the second highest GDP per capita ($11,400) but school life expectancy is the third lowest of all ten MDG regions. Southern Asia has the second lowest school life expectancy with 9.6 years and an average GDP per capita of $2,600. The lowest school life expectancy is observed in Sub-Saharan Africa (7.7 years) and this region also has the lowest GDP per capita ($1,800).
MDG regions: school life expectancy, GDP per capita, and total population, 2006
| MDG region | School life expectancy (years) | GDP per capita, PPP (current international $) | Total population (1,000) |
| Developed countries | 15.8 | 33,508 | 1,015,487 |
| Commonwealth of Independent States | 13.4 | 9,371 | 278,295 |
| Eastern Asia | 11.4 | 5,471 | 1,402,837 |
| South-Eastern Asia | 11.3 | 4,190 | 565,105 |
| Oceania | 11.4 | 2,323 | 8,804 |
| Southern Asia | 9.6 | 2,649 | 1,612,841 |
| Western Asia | 11.0 | 11,394 | 200,205 |
| Northern Africa | 12.2 | 5,433 | 155,086 |
| Sub-Saharan Africa | 7.7 | 1,818 | 788,122 |
| Latin America and the Caribbean | 13.5 | 9,109 | 564,732 |
| World | 11.5 | 9,262 | 6,591,513 |
A related article on this site analyzes the link between national wealth and school enrollment at the primary and secondary level of education. Countries with a high GDP per capita usually have higher net enrollment rates than countries with a low GDP per capita. This relationship is particularly strong at the secondary level of education. Two articles on poverty and educational attainment in the United States examine poverty rates and high school graduation rates in the 50 U.S. states.
Data sources
- School life expectancy: UNESCO Institute for Statistics, Data Centre, May 2008
- GDP per capita: World Bank, World Development Indicators Online, July 2008
- Population: UN Population Division, World Population Prospects: The 2006 Revision, March 2007
- Household wealth and years of education
- National wealth and school enrollment
- Poverty and educational attainment in the United States
- Poverty and educational attainment in the United States, part 2
- Millennium Development Goal regions and UNICEF regions
- Gross domestic product (Wikipedia article)
- School life expectancy (definition by the UNESCO Institute for Statistics)
- Purchasing power parity (Wikipedia article)
- Logarithmic scale (Wikipedia article)
- UNESCO Institute for Statistics
- World Bank
- UN Population Division
- UN Millennium Development Goals
Permanent URL: http://huebler.blogspot.com/2008/08/wealth.html


