Showing posts with label preschool. Show all posts

School attendance among 5- to 24-year-olds in Liberia

An article that was published on this site in July 2011, "School attendance by grade and age in Liberia", shows that overage school attendance is very common in Liberia, mainly due to late entry into the education system. The official primary school age in Liberia is 6 to 11 years according to the International Standard Classification of Education (ISCED). Yet, an analysis of data from a Demographic and Health Survey (DHS) from 2007 demonstrates that the vast majority of pupils in primary and secondary school in Liberia are older than the theoretical age for their grade. For example, nearly three quarters of all first-graders in Liberia are at least 3 years older than the official entrance age into primary education (see Figure 1). 24% of all first-graders are 5 or 6 years overage, 14% are 7 or 8 years overage, and 5% are 9 or more years overage. Children in the last group start primary school at age 15 or later.

Figure 1: Age distribution of pupils in primary and secondary education in Liberia, 2007
Graph with data on overage and underage pupils in primary and secondary education in Liberia
Source: Demographic and Health Survey (DHS) 2007. - Click image to enlarge.

Figure 1 shows the age distribution in the 12 grades of primary and secondary education in Liberia. The same DHS data from 2007 can also be analyzed differently, by single year of age instead of by grade. Figure 2 presents the level and grade attended for the population between 5 and 24 years of age. For each age group, the graph shows the percentage in pre-primary, primary, secondary, and tertiary education. The data for primary and secondary education is further divided into single grades, indicated by shades of blue for the 6 primary grades and shades of green for the 6 secondary grades. In addition, Figure 2 shows how many percent are out of school and for how many percent the level and grade of education attended is missing.

Figure 2: Level and grade of education attended by population 5-24 years in Liberia, 2007
Graph with data on school attendance by age in Liberia
Source: Demographic and Health Survey (DHS) 2007. - Click image to enlarge.

One surprising finding is the large percentage of children between 5 and 14 years who are in pre-primary education. About half of all 5- to 8-year-olds, 39% of all 9-year-olds, and 28% of all 10-year-olds are in pre-primary education. Even at age 14, nearly 7% are still in preschool. One possible explanation is that parents keep their children in pre-primary education due to lack of access to primary education.

Some children start attending primary education at age 5 or 6 but most children enter late. Even among persons 20 years or older, some are still in the first primary grade. School attendance overall reaches a peak at age 14, when more than 86% are in school, mostly in primary education. Primary school attendance rates are highest among 12- to 15-year-olds; two out of three children in this age group are in primary education. Secondary school attendance reaches a peak at age 19, when 38% are in secondary education; in addition, at least 30% of all 17- and 18-year-olds are in secondary education. Attendance rates for tertiary education are low and do not exceed 2% until age 24, when 4% study at a university or other institution of higher learning.

The percentage of the population that is not in any type of formal education decreases from 44% among 5-year-olds to 13% among 14-year-olds. From age 15, out-of-school rates increase again and among 23- and 24-year-olds in Liberia, 61% and 60%, respectively, are not in school. Lastly, for a small percentage of the DHS sample, the grade and level attended was missing.

Related articles

External links

Friedrich Huebler, 30 April 2012, Creative Commons License
Permanent URL: http://huebler.blogspot.com/2012/04/liberia.html

World Atlas of Gender Equality in Education

Cover of the UNESCO gender atlas

UNESCO and the UNESCO Institute for Statistics (UIS) have published a new World Atlas of Gender Equality in Education that illustrates the participation of girls and boys in pre-primary, primary, secondary, and tertiary education. The data show that there has been significant progress towards gender parity since the 1970s. Two thirds of all countries have reached gender parity in primary education but at the secondary level of education girls are still lagging behind. In some countries, girls have the advantage with regard to access to and completion of education. At the tertiary level, female students outnumber male students in many high-income countries.

The atlas is divided into eight chapters that contain a total of 28 maps and close to 100 charts and tables:

  1. Increased worldwide demand for quality schooling
  2. Girls’ right to education
  3. Enrolment and gender trends: primary education
  4. Enrolment and gender trends: secondary education
  5. Enrolment and gender trends: tertiary education
  6. Trends in school-life expectancy
  7. Gender trends: adult and youth literacy
  8. How policies affect gender equality in education

An excerpt from Chapter 7 on literacy is shown below. The map (please click the image for a larger view) visualizes adult literacy rates from the database of the UNESCO Institute for Statistics. Among countries with data, literacy rates are lowest in sub-Saharan Africa and South Asia. The highest adult literacy rates are observed in Eastern Europe and Central Asia. For many developed countries, the adult literacy rate is unknown because these countries have achieved universal primary education and no longer report data on the traditional literate-illiterate dichotomy, focusing instead on the more narrowly defined concept of functional literacy.

The atlas is available in English, French and Spanish. In addition, UNESCO and UIS plan to launch an online e-atlas with interactive maps.

Excerpt from World Atlas of Gender Equality in Education: Map with adult literacy rates
World map with adult literacy rates
Source: UNESCO, 2012, World Atlas of Gender Equality in Education, pages 92-93. - Click image to enlarge.

Reference

External links

Related articles

Friedrich Huebler, 31 March 2012, Creative Commons License
Permanent URL: http://huebler.blogspot.com/2012/03/atlas.html

School attendance in Brazil

Brazil is the largest and most populous country in South America. The Brazilian Institute of Geography and Statistics (IBGE) estimates that the population of Brazil grew to 190 million in 2008. The World Bank ranks Brazil as the world's tenth largest economy with a gross domestic product (GDP) of $1.3 trillion in 2007.

Brazil has achieved high levels of school attendance and literacy. The UNESCO Institute for Statistics (UIS) estimates that 94 percent of all children of primary school age were enrolled in primary school in 2005, the latest year with data. The youth literacy rate, for persons aged 15 to 24 years, was 99 percent in 2007 according to the UIS. Among the adult population aged 15 years and older, 91 percent were literate in 2007. In contrast, in 1980 only 75 percent of the adult population of Brazil could read and write.

The patterns of school attendance in Brazil can be studied in greater detail with data from the 2006 National Household Sample Survey (Pesquisa Nacional por Amostra de DomicĂ­lios, PNAD). The survey collected data on current and past school attendance for all household members, regardless of age. For the analysis that follows, the levels of education in the PNAD data were recoded to match the International Standard Classification of Education (ISCED) of 1997. Five levels of education are identified:
  • Pre-primary education
  • Primary education
  • Secondary education
  • Tertiary education
  • Adult literacy programs
Adult literacy programs are not part of the ISCED classification but they play an important role in Brazil and are therefore included as a separate group. The graph below illustrates current school attendance by age and level of education for the population aged 0 to 30 years. The number at the top of each bar is the percent of persons of a particular age that are currently in school. For example, 97 percent of all 7-year-olds were in school at the time of the survey; the majority attended primary school but more than 10 percent of all 7-year-olds were still in preschool.

The official school ages in Brazil are indicated along the horizontal axis. The official entrance age for pre-primary education is 4 years, primary education begins at 7 years, and secondary education at 11 years. Education is compulsory for all children aged 7 to 14 years.

Brazil: Current school attendance by age and level of education, 2006
Level of education attended for persons 0 to 30 years, Brazil 2006
Data source: Brazil National Household Sample Survey (PNAD), 2006.

The PNAD data show that many young children in Brazil attend pre-primary education. Two thirds of all children between 4 and 6 years are in preschool or day care. The laws on compulsory education have the desired effect and almost all children between 7 and 14 years are in fact in school. The attendance rates in this age group range from 94 percent among 14-year-olds to 99 percent among 8- to 11-year-olds. Among children of secondary school age, the attendance rate drops steadily from 99 percent at age 11 to 74 percent at age 17. About 8 percent of 18-year-olds are in tertiary education. University attendance rates reach a peak of 15 percent among 20- to 22-year-olds.

Overage school attendance is relatively common in Brazil and many children older than 10 years are still in primary school. Persons up to and beyond age 30 attend secondary education. These high levels of primary and secondary school attendance among the older population are partly a result of a system of education that offers persons who dropped out of school an opportunity to continue their education later in life. Adult literacy programs reach a relatively small part of the population but they contribute to the high level of literacy in Brazil. About 0.5 to 1 percent of the population between 30 and 75 years participate in programs that teach reading and writing.

Data sources
Related articles
External links
Friedrich Huebler, 8 November 2008 (edited 24 January 2009), Creative Commons License
Permanent URL: http://huebler.blogspot.com/2008/11/brazil.html

Primary school attendance in Nepal, 1996-2006

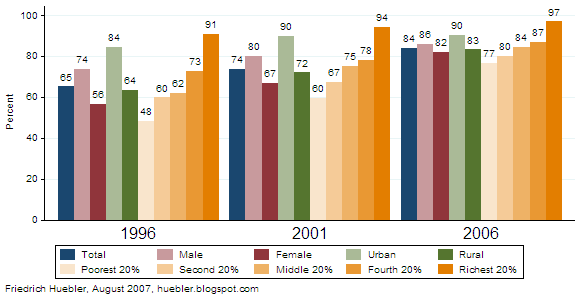
In 2006, a Demographic and Health Survey (DHS) collected data on school attendance in Nepal. A comparison with data from earlier DHS surveys, conducted in 1996 and 2001, shows a steady increase in primary school attendance over the last decade. The primary school net attendance rate (NAR) - the share of children of primary school age who attend primary school - has increased by almost 10 percentage points every five years, from 65 percent in 1996 to 84 percent in 2006. If Nepal can sustain this rate of increase it will reach the Millennium Development Goal of universal primary education by 2015.

The increase in attendance was accompanied by a reduction in disparities between boys and girls, residents of urban and rural areas, and children from different household wealth quintiles (see the graph and table below). Much of the increase in primary school attendance is due to higher attendance rates in rural areas, especially over the period 2001 to 2005, when attendance in urban areas grew only marginally.

Primary school net attendance rate (%), Nepal 1996-2006
Bar graph with trends in primary school attendance in Nepal, 1996-2006
Data source: Nepal Demographic and Health Surveys, 1996, 2001, 2006.

Children from the poorest 20 percent of all households saw the biggest increase in primary school attendance, from 48 percent in 1996 to 77 percent 2006. The difference in the primary NAR between children from the richest and poorest household quintiles fell by more than half over the same period, from 42 percent in 1996 to 20 percent in 2006.

Nepal also achieved a marked reduction in gender disparity over the past 10 years. In 1996, only 56 percent of all girls of primary school age attended primary school. This share grew to 82 percent by 2006. The primary NAR of boys grew from 74 percent to 86 percent over the same period. With a gender parity index (GPI) of 0.95 - the ratio of female to male NAR - Nepal has almost reached the Millennium Development Goal of gender parity in primary education.

Primary school net attendance rate (%), Nepal 1996-2006

199620012006Change 1996 to 2006
Total65.173.584.119.0
Male73.679.986.012.3
Female56.466.882.025.6
Urban84.389.890.25.9
Rural63.672.083.219.6
Poorest 20%48.459.676.728.3
Second 20%59.767.479.820.1
Middle 20%62.075.184.322.3
Fourth 20%72.678.286.914.3
Richest 20%90.694.396.96.2
Data source: Nepal Demographic and Health Surveys, 1996, 2001, 2006.

Comments on the 2006 DHS data

The authors of the final survey report from the 2006 DHS in Nepal counted children in school-based pre-primary centers as primary school students for the calculation of the primary school NAR. Children in informal, community based preschool classes were excluded from the calculation of the primary NAR. The author of this article chose the same approach.

A UNESCO country profile of Nepal prepared for the Education for All Global Monitoring Report 2007 explains that "there are significant differences in the way the school based and the community based [early childhood development centres] are running. Most of the school based centres are run by the DEO [District Education Office], and most of them are more primary schools than development centres."

The statement by UNESCO supports the treatment of children in school-based pre-primary centers in Nepal as equivalent to children in primary school for statistical purposes. In developing countries it is not uncommon to find children of primary school age in preschool but because of national differences the interpretation of the data from Nepal cannot necessarily be applied to other countries.

Related articles
External links
Friedrich Huebler, 14 August 2007 (edited 12 October 2008), Creative Commons License
Permanent URL: http://huebler.blogspot.com/2007/08/primary-school-attendance-in-nepal-1996.html

Education country profiles by UNICEF

In addition to its main web site at unicef.org, UNICEF maintains a separate web site at childinfo.org with a wide range of statistics on issues related to children and women. In the area of education, the Childinfo web site provides a complete set of country profiles with current statistics for 206 countries and territories, from Afghanistan to Zimbabwe. Complete profiles have three sections, with past trends, the current state of the education system, and prospects for 2015. The section on trends contains up to six graphs with data from 1980 to the present.
  • Pre-primary school gross and net enrollment rates
  • Primary school net enrollment and net attendance rates
  • Secondary school net enrollment and net attendance rates
  • Survival rate to grade 5
  • Pupil/teacher ratio
  • Education expenditures as percent of GDP and as percent of total government expenditures
The section on the current state of the education system lists up to two tables and six graphs.
  • Statistics from the education database of the UNESCO Institute for Statistics (UIS): population; official school ages; preschool, primary school, and secondary school enrollment; intake, transition rates, repetition, and completion rates; teaching staff; education expenditures
  • Statistics from a recent household survey, usually a Multiple Indicator Cluster Survey (MICS) or Demographic and Health Survey (DHS): primary and secondary school attendance; intake, transition, repetition, and completion rates
  • Three graphs on disparity in primary school attendance - by gender, area of residence, and household wealth - with data from a recent household survey
  • Three graphs on gender disparity in secondary school - by gender, area of residence, and household wealth - with data from a recent household survey
For countries with household survey data, two final graphs show school attendance rates between 2000 and 2015, the target year for the UN Millennium Development Goals.
  • Predicted primary school net attendance rate, by gender
  • Predicted secondary school net attendance rate, by gender
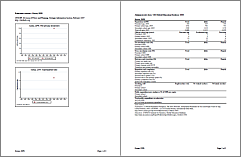
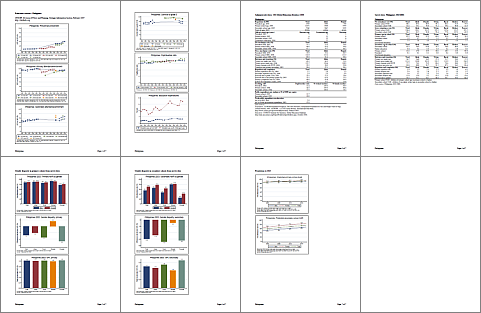
The level of detail of the country profiles varies, depending on the availability of education statistics for each country. The profile for North Korea, shown in Figure 1, has only two pages and contains virtually no data. In contrast, the country profile for the Philippines, shown in Figure 2, has seven pages with fourteen graphs and two tables and provides data for all indicators listed above.

Figure 1: Education country profile for North Korea
UNICEF's education country profile for North Korea
Source: UNICEF Childinfo web site, childinfo.org, March 2007.

Figure 2: Education country profile for the Philippines
UNICEF's education country profile for the Philippines
Source: UNICEF Childinfo web site, childinfo.org, March 2007.

On the Childinfo web site, all countries are grouped by UNICEF region. The majority of the data in the country profiles is from the UNESCO Institute for Statistics and from MICS and DHS surveys.

Related articles
External links
Friedrich Huebler, 25 March 2007, Creative Commons License
Permanent URL: http://huebler.blogspot.com/2007/03/education-country-profiles-by-unicef.html