Showing posts with label map. Show all posts

Adult and youth literacy in 2011

8 September is International Literacy Day, an occasion to reflect on the status of literacy worldwide. Globally, 84% of all adults 15 years and older were able to read and write in 2011, the most recent year for which the UNESCO Institute for Statistics (UIS) has released data (see Table 1). Two regions, Central and Eastern Europe and Central Asia, are near universal literacy, with adult literacy rates of 99% and 100%, respectively. Literacy rates are assumed to be at a similarly high level in North America and Western Europe but data coverage is insufficient for the calculation of a regional average. Literacy rates are also high in East Asia and the Pacific (95%) and in Latin America and the Caribbean (92%). In the remaining regions, adult literacy rates are below the global average: Arab States (77%), South and West Asia (63%), and sub-Saharan Africa (59%).

Male and female adult literacy rates are at nearly the same levels in three regions: Central and Eastern Europe, Central Asia, and Latin America and the Caribbean (see Table 1). In the Arab States, East Asia and the Pacific, South and West Asia, and sub-Saharan Africa, female literacy rates are lower than male literacy rates. The gender parity index (GPI), the ratio of the female over the male literacy rate, shows that the biggest gender gap exists in South and West Asia (GPI 0.70) and in sub-Saharan Africa (GPI 0.74). Globally, the male literacy rate is 89% and the female literacy rate 80%, which yields a GPI of 0.90, far below the range of gender parity with GPI values between 0.97 and 1.03.

Table 1: Adult and youth literacy rate, 2011
Region Adult literacy rate (%) Youth literacy rate (%)
Total Male Female GPI Total Male Female GPI
Arab States 76.9 84.7 68.4 0.81 89.9 93.2 86.5 0.93
Central and Eastern Europe 98.5 99.3 97.8 0.99 99.3 99.5 99.2 1.00
Central Asia 99.5 99.6 99.4 1.00 99.7 99.6 99.8 1.00
East Asia and the Pacific 94.7 96.9 92.5 0.95 98.9 98.9 98.8 1.00
Latin America and the Caribbean 91.6 92.2 90.9 0.99 97.1 96.8 97.4 1.01
North America and Western Europe - - - - - - - -
South and West Asia 62.8 74.0 51.9 0.70 80.7 86.8 74.9 0.86
Sub-Saharan Africa 59.1 68.1 50.6 0.74 69.5 75.6 63.7 0.84
World 84.1 88.6 79.9 0.90 89.5 92.2 86.8 0.94
Note: GPI = gender parity index.
Source: UNESCO Institute for Statistics, Data Centre, September 2013.

National adult literacy rates are displayed in Figure 1. Countries in sub-Saharan Africa and South and West Asia have generally lower literacy rates than countries in other regions. In 11 countries, nearly all in sub-Saharan Africa, fewer than half of all adults are able to read and write: Benin, Burkina Faso, Chad, Ethiopia, Guinea, Haiti, Liberia, Mali, Niger, Senegal, and Sierra Leone.

Figure 1: Adult literacy rate, 2011

Source: UNESCO Institute for Statistics, Data Centre, September 2013. - Click image to enlarge.

The UIS estimates that the adult illiterate population was 774 million in 2011 (see Table 2). Three out of four illiterate adults live in only two regions: South and West Asia (407 million) and sub-Saharan Africa (182 million). In all regions, the number of illiterate women is larger than the number of illiterate men. Globally, 493 million or two thirds of the adult illiterate population are female.

Table 2: Adult and youth illiterate population, 2011
Region Adult illiterate population (000) Youth illiterate population (000)
Total Male Female % female Total Male Female % female
Arab States 47,603 16,082 31,521 66.2 6,037 2,099 3,938 65.2
Central and Eastern Europe 4,919 1,104 3,815 77.5 386 157 229 59.4
Central Asia 290 108 182 62.7 45 30 14 32.5
East Asia and the Pacific 89,478 26,356 63,122 70.5 4,081 2,005 2,076 50.9
Latin America and the Caribbean 35,614 15,994 19,620 55.1 3,043 1,676 1,367 44.9
North America and Western Europe - - - - - - - -
South and West Asia 407,021 147,352 259,669 63.8 61,778 22,316 39,461 63.9
Sub-Saharan Africa 181,950 70,535 111,414 61.2 47,558 19,196 28,362 59.6
World 773,549 280,366 493,184 63.8 123,198 47,626 75,571 61.3
Source: UNESCO Institute for Statistics, Data Centre, September 2013.

The global youth literacy rate, for the population 15 to 24 years of age, was 90% in 2011 (see Table 1). Youth literacy rates are higher than adult literacy rates in all regions, a result of increased levels of school attendance among younger generations. Of the regions with data, four are near universal youth literacy: Central and Eastern Europe (99%), Central Asia (100%), East Asia and the Pacific (99%), and Latin America and the Caribbean (97%). In the Arab States, the youth literacy rate is 90%. In South and West Asia (81%) and sub-Saharan Africa (70%), the youth literacy rate is below the global average.

Literacy rates among the population 15-24 years are not only higher than among the total population 15 years and older, there is also a smaller gap between the literacy rates of young men and women (see Table 1). However, gender disparity in youth literacy is observed in the Arab States (GPI 0.93), South and West Asia (GPI 0.86), and sub-Saharan Africa (GPI 0.84); in these regions, young women are less likely to be able to read and write than young men. At the global level, the male youth literacy rate is 92% and the female youth literacy rate 87%.

National youth literacy rates are displayed in Figure 2. Sub-Saharan Africa stands out as the one region where youth literacy rates are significantly lower than in other regions. Seven countries have youth literacy rates below 50%: Benin, Burkina Faso, Chad, Guinea, Liberia, Mali, and Niger.

Figure 2: Youth literacy rate, 2011

Source: UNESCO Institute for Statistics, Data Centre, September 2013. - Click image to enlarge.

The youth illiterate population, a subset of the adult illiterate population, was estimated at 123 million in 2011 (see Table 2). Illiterate youth are concentrated in South and West Asia and sub-Saharan Africa; 89% of the global population of illiterate youth live in these two regions. Whereas women are the majority of illiterate adults in all regions, there is no such clear pattern among illiterate youth. In two regions, Central Asia and Latin America and the Caribbean, young men are more likely to lack basic reading and writing skills than young women. Even so, 61% of the global number of illiterate youth are female.

More detailed statistics and analysis are available from the the UNESCO Institute for Statistics, including a page with an interactive world map with adult and youth literacy rates, a fact sheet on adult and youth literacy, an infographic for International Literacy Day 2013, and a report on national, regional and global trends in adult and youth literacy between 1985 and 2015.

Related articles

External links

Friedrich Huebler, 8 September 2013, Creative Commons License
Permanent URL: http://huebler.blogspot.com/2013/09/literacy.html

Guide to creating maps with Stata

Most charts and maps on this site were created with the Stata statistical software package. This guide explains how maps like those with adult and youth literacy rates in 2010 can be created with Stata. The article supersedes an earlier version from 2005 and introduces updated maps with current country borders. For example, South Sudan, which seceded from Sudan in 2011, is shown as a separate country on the new maps. The instructions below are for Stata version 9 or later. Users of Stata 8 are referred to the guide from 2005. The creation of maps is not supported in older versions of Stata.

Requirements

  • Stata version 9.2 or later.
  • spmap: Stata module for drawing thematic maps, by Maurizio Pisati. spmap can be installed in Stata with this command:
      ssc install spmap
  • shp2dta: Stata module for converting shapefiles to Stata format, by Kevin Crow. shp2dta can be installed in Stata with this command:
      ssc install shp2dta
  • Shapefile: A shapefile is a data format for geographic information systems. For the maps in Figures 1 and 2, please download this public domain shapefile from Natural Earth:
    110m-admin-0-countries.zip (158 KB, world map with country borders, scale 1:110,000,000)

Step 1: Convert shapefile to Stata format

  • Unzip 110m-admin-0-countries.zip to a folder that is visible to Stata. The archive contains four files:
    ne_110m_admin_0_countries.dbf
    ne_110m_admin_0_countries.prj
    ne_110m_admin_0_countries.shp
    ne_110m_admin_0_countries.shx
  • Start Stata and run this command:
      shp2dta using ne_110m_admin_0_countries, data(worlddata) coor(worldcoor) genid(id)
  • Two new files will be created: worlddata.dta (with the country names and other information) and worldcoor.dta (with the coordinates of the country boundaries).
  • If you plan to superimpose labels on a map, for example country names, run the following command instead, which adds centroid coordinates to the file worlddata.dta:
      shp2dta using ne_110m_admin_0_countries, data(worlddata) coor(worldcoor) genid(id) genc(c)
  • Please refer to the spmap documentation to learn more about labels.
  • The DBF, PRJ, SHP, and SHX files are no longer needed and can be deleted.

Step 2: Draw map with Stata

  • Open worlddata.dta in Stata.
  • For the example maps, create a variable with the length of each country's name. The Stata command for this is:
      generate length = length(ADMIN)
  • Draw a map that indicates the length of all country names with this command:
      spmap length using worldcoor.dta, id(id)
  • The default map (Figure 1) is grayscale, it shows Antarctica, there are four classes for the length of the country names, the legend is very small, and the legend values are arranged from high to low.

Figure 1: Length of country names (small scale map, default style)

Click image to enlarge.

  • A second map without Antarctica, with a blue palette, five classes, and with a bigger legend with values arranged from low to high (Figure 2) can be drawn with this command:
      spmap length using worldcoor.dta if ADMIN!="Antarctica", id(id) fcolor(Blues) clnumber(5) legend(symy(*2) symx(*2) size(*2)) legorder(lohi)
  • Darker colors on the map indicate longer country names, ranging from 4 (for example Cuba and Fiji) to 35 characters (French Southern and Antarctic Lands).
  • Please read the Stata help file for spmap to learn about the many additional options for customization of maps.

Figure 2: Length of country names (small scale map, blue palette)

Click image to enlarge.

Alternative maps with more detail

The shapefile that was used for Figures 1 and 2 was designed for small maps. It contains the borders for 177 countries and territories and does not include smaller geographic units like Hong Kong, Monaco, or St. Vincent and the Grenadines. As an alternative to the small scale map in Figures 1 and 2, Natural Earth offers shapefiles with more detail that were designed for larger maps.

  • To create the map in Figure 3, download this shapefile from Natural Earth, which has information for 242 countries and territories:
    50m-admin-0-countries.zip (1.3 MB, world map with country borders, scale 1:50,000,000)
  • Unzip 50m-admin-0-countries.zip to a folder that is visible to Stata.
  • Run this Stata command to convert the shapefile to Stata format:
      shp2dta using ne_50m_admin_0_countries, data(worlddata2) coor(worldcoor2) genid(id)
  • If you need Stata files with centroids, run this command instead:
      shp2dta using ne_50m_admin_0_countries, data(worlddata2) coor(worldcoor2) genid(id) genc(c)
  • Open worlddata2.dta in Stata.
  • Create a variable with the length of each country's name:
      generate length = length(ADMIN)
  • Draw the map in Figure 3:
      spmap length using worldcoor2.dta if ADMIN!="Antarctica", id(id) fcolor(Blues) clnumber(5) legend(symy(*2) symx(*2) size(*2)) legorder(lohi)
  • The map takes longer to draw than the map in Figures 1 and 2 because it is more detailed and shows more geographic units. The names of the countries and territories on the map have a length up to 40 characters (South Georgia and South Sandwich Islands).

Figure 3: Length of country names (medium scale map)

Click image to enlarge.

  • To create the map in Figure 4, download this shapefile from Natural Earth, which has information for 253 countries and territories, including small islands like the Ashmore and Cartier Islands:
    10m-admin-0-countries.zip (6.7 MB, world map with country borders, scale 1:10,000,000)
  • Unzip 10m-admin-0-countries.zip to a folder that is visible to Stata.
  • Run this Stata command to convert the shapefile to Stata format:
      shp2dta using ne_10m_admin_0_countries, data(worlddata3) coor(worldcoor3) genid(id)
  • If you need Stata files with centroids, run this command instead:
      shp2dta using ne_10m_admin_0_countries, data(worlddata3) coor(worldcoor3) genid(id) genc(c)
  • Open worlddata3.dta in Stata.
  • Create a variable with the length of each country's name:
      generate length = length(ADMIN)
  • Draw the map in Figure 4:
      spmap length using worldcoor3.dta if ADMIN!="Antarctica", id(id) fcolor(Blues) clnumber(5) legend(symy(*2) symx(*2) size(*2)) legorder(lohi)
  • The map takes longer to draw than the maps in Figures 1, 2 and 3 because it has the largest amount of detail. The differences between the maps in Figures 3 and 4 can be seen by clicking on the images to enlarge them. Figure 4 has more islands and more detailed shorelines. The names of the countries and territories on the map in Figure 4 have a length up to 40 characters (South Georgia and South Sandwich Islands).

Figure 4: Length of country names (large scale map)

Click image to enlarge.

Software used in this guide

  • Stata: statistical software package
  • spmap: Stata module for drawing thematic maps, by Maurizio Pisati
  • shp2dta: Stata module for converting shapefiles to Stata format, by Kevin Crow
  • 110m-admin-0-countries.zip: small scale (1:110,000,000) Natural Earth world map with country borders (158 KB)
  • 50m-admin-0-countries.zip: medium scale (1:50,000,000) Natural Earth world map with country borders (1.3 MB)
  • 10m-admin-0-countries.zip: large scale (1:10,000,000) Natural Earth world map with country borders (6.7 MB)

Related articles

External links

Friedrich Huebler, 31 August 2012 (edited 2 September 2012), Creative Commons License
Permanent URL: http://huebler.blogspot.com/2012/08/stata-maps.html

Adult and youth literacy in 2010

The UNESCO Institute for Statistics (UIS) released new literacy data in April 2012, with updated estimates of adult and youth literacy. In 2010, the latest year with data, 84% of the global population 15 years and older were estimated to be able to read and write (see Table 1). At the regional level, literacy rates are highest in Central Asia, Central and Eastern Europe, East Asia and the Pacific, and Latin America and the Caribbean. In these regions at least 9 out of 10 adults are literate. Literacy rates can be assumed to be as high in North America and Western Europe but not enough countries in that region collect literacy data to allow the calculation of a regional average. By contrast, adult literacy rates are significantly lower in the Arab States (75%), and in South and West Asia and sub-Saharan Africa (63% in both regions). Women are considerably less likely to be literate than men in the Arab States, East Asia and the Pacific, South and West Asia, and sub-Saharan Africa. Globally, the female adult literacy rate was estimated to be 80% in 2010, compared to a literacy rate of 89% for men. As a consequence, nearly two thirds (497 million) of the adult illiterate population in 2010 (775 million) were women.

Table 1: Adult and youth literacy rate, 2010
Region Adult literacy rate (%) Youth literacy rate (%)
Total Male Female Total Male Female
Arab States 74.7 83.3 65.7 89.1 92.4 85.6
Central Asia 99.5 99.6 99.4 99.7 99.6 99.8
Central and Eastern Europe 97.9 99.0 97.0 99.1 99.3 98.9
East Asia and the Pacific 94.2 96.7 91.6 98.8 98.9 98.7
Latin America and the Caribbean 91.4 92.1 90.7 97.2 97.0 97.4
North America and Western Europe - - - - - -
South and West Asia 62.7 74.0 51.8 80.5 86.6 74.7
Sub-Saharan Africa 62.6 71.0 54.2 71.8 76.4 66.8
World 84.1 88.6 79.7 89.6 92.2 87.1
Source: UNESCO Institute for Statistics, Data Centre, April 2012

The disparities between regions with high and low literacy rates are readily apparent from the map in Figure 1, which displays the average literacy rate in the seven Education for All (EFA) regions with data listed in Table 1. For a description of the regional groupings, please refer to a past article about the EFA regions on this website.

Figure 1: Regional adult literacy rate, 2010

Source: UNESCO Institute for Statistics, Data Centre, April 2012. - Click image to enlarge.

Youth literacy rates, for the population 15 to 24 years of age, are higher than adult literacy rates in all regions as a result of improved access to education among younger generations. Globally, 90% of all youth are able to read and write. Central Asia, Central and Eastern Europe, East Asia and the Pacific, and Latin America and the Caribbean have reached or are approaching universal literacy among their young population. The same can be assumed for North America and Western Europe, but no regional average is available from the UIS (see Table 1 and Figure 2). The disparity in literacy rates between men and women is generally smaller among the population 15 to 24 years than among the population 15 years and older. Yet, in the Arab States, South and West Asia, and sub-Saharan Africa, young women remain less likely to be able to read and write than young men. The global youth literacy rate in 2010 was 92% for men and 87% for women.

Figure 2: Regional youth literacy rate, 2010

Source: UNESCO Institute for Statistics, Data Centre, April 2012. - Click image to enlarge.

The regional averages can conceal large differences between countries within a region. This is particularly true for the adult literacy rate in the Arab States, South and West Asia, and sub-Saharan Africa (see Figure 3). In sub-Saharan Africa, for example, the adult literacy rate is below 30% in Burkina Faso and Niger - the countries with the least literate population worldwide - and above 90% in Equatorial Guinea, Seychelles, and Zimbabwe.

Figure 3: Adult literacy rate, 2010

Source: UNESCO Institute for Statistics, Data Centre, April 2012. - Click image to enlarge.

Disparities between countries within a region can also be observed for the youth literacy rate, but to a lesser degree than for the adult literacy rate (see Figure 4). Similar to the adult literacy rate, the greatest disparities exist in sub-Saharan Africa, where youth literacy rates range from 37% in Niger to 99% in the Seychelles and Zimbabwe.

Figure 4: Youth literacy rate, 2010

Source: UNESCO Institute for Statistics, Data Centre, April 2012. - Click image to enlarge.

To make it easier to explore its literacy data, the UNESCO Institute for Statistics has created an interactive visualization that combines a map showing adult and youth literacy rates, a graph with literacy rates by sex, and a scatter plot with the correlation between GDP per capita and literacy. A screenshot of the visualization is shown in Figure 5. The full visualization is available on the website of the UIS. Literacy data are also contained in the recently published World Atlas of Gender Equality in Education by UNESCO.

Figure 5: UIS data visualization with adult and youth literacy rate, 2010

Source: UNESCO Institute for Statistics, May 2012. - Click image to enlarge.

Related articles

External links

Friedrich Huebler, 31 May 2012 (edited 1 June 2012), Creative Commons License
Permanent URL: http://huebler.blogspot.com/2012/05/literacy.html

World Atlas of Gender Equality in Education

Cover of the UNESCO gender atlas

UNESCO and the UNESCO Institute for Statistics (UIS) have published a new World Atlas of Gender Equality in Education that illustrates the participation of girls and boys in pre-primary, primary, secondary, and tertiary education. The data show that there has been significant progress towards gender parity since the 1970s. Two thirds of all countries have reached gender parity in primary education but at the secondary level of education girls are still lagging behind. In some countries, girls have the advantage with regard to access to and completion of education. At the tertiary level, female students outnumber male students in many high-income countries.

The atlas is divided into eight chapters that contain a total of 28 maps and close to 100 charts and tables:

  1. Increased worldwide demand for quality schooling
  2. Girls’ right to education
  3. Enrolment and gender trends: primary education
  4. Enrolment and gender trends: secondary education
  5. Enrolment and gender trends: tertiary education
  6. Trends in school-life expectancy
  7. Gender trends: adult and youth literacy
  8. How policies affect gender equality in education

An excerpt from Chapter 7 on literacy is shown below. The map (please click the image for a larger view) visualizes adult literacy rates from the database of the UNESCO Institute for Statistics. Among countries with data, literacy rates are lowest in sub-Saharan Africa and South Asia. The highest adult literacy rates are observed in Eastern Europe and Central Asia. For many developed countries, the adult literacy rate is unknown because these countries have achieved universal primary education and no longer report data on the traditional literate-illiterate dichotomy, focusing instead on the more narrowly defined concept of functional literacy.

The atlas is available in English, French and Spanish. In addition, UNESCO and UIS plan to launch an online e-atlas with interactive maps.

Excerpt from World Atlas of Gender Equality in Education: Map with adult literacy rates
World map with adult literacy rates
Source: UNESCO, 2012, World Atlas of Gender Equality in Education, pages 92-93. - Click image to enlarge.

Reference

External links

Related articles

Friedrich Huebler, 31 March 2012, Creative Commons License
Permanent URL: http://huebler.blogspot.com/2012/03/atlas.html

Adult and youth literacy in 2009

8 September was International Literacy Day. On this occasion, the UNESCO Institute for Statistics (UIS) released a fact sheet with estimates of adult and youth literacy in 2009, the most recent year with data.

The global adult literacy rate, for the population 15 years and older, was 83.7% in 2009, compared to 83.4% in 2008. The adult illiterate population fell from 796.2 million in 2008 to 793.1 million in 2009. 64.1% of the adult illiterate population were women. Adult literacy rates are lowest in sub-Saharan African and in South and West Asia (see Figure 1). In 11 countries, less than half of the adult population were able to read and write: Benin, Burkina Faso, Chad, Ethiopia, Gambia, Guinea, Haiti, Mali, Niger, Senegal and Sierra Leone.

Figure 1: Adult literacy rate, 2009
World map with adult literacy rates in 2009
Source: UNESCO Institute for Statistics, 2011

Youth literacy rates - for the population 15 to 24 years - are generally higher than adult literacy rates, due to increased school attendance rates among younger generations. The global youth literacy rate was 89.3% in 2009, compared to 89.0% in 2008. The youth illiterate population fell from 130.6 million in 2008 to 127.3 million in 2009. Youth literacy rates are lowest in sub-Saharan Africa (see Figure 2) and the five countries worldwide with youth literacy rates below 50% are from this region: Burkina Faso, Chad, Ethiopia, Mali and Niger.

Figure 2: Youth literacy rate, 2009
World map with youth literacy rates in 2009
Source: UNESCO Institute for Statistics, 2011

Reference

  • UNESCO Institute for Statistics (UIS). 2011. Adult and youth literacy. UIS fact sheet no. 16, September. Montreal: UIS. (Download in PDF format, 350 KB)

Related articles

External links

Friedrich Huebler, 30 September 2011, Creative Commons License
Permanent URL: http://huebler.blogspot.com/2011/09/literacy.html

Education for All regions

For monitoring of progress towards the six Education for All (EFA) goals, the world has been divided into eight EFA regions:
  • North America and Western Europe
  • Central and Eastern Europe
  • Central Asia
  • East Asia and the Pacific
  • South and West Asia
  • Arab States
  • Sub-Saharan Africa
  • Latin America and the Caribbean
These regions, shown in the map below, are used in publications like the EFA Global Monitoring Report by UNESCO or the Global Education Digest by the UNESCO Institute for Statistics.

Regions for monitoring of Education for All goals
World map with Education for All (EFA) regions

Combined, the eight EFA regions cover 204 countries and territories. Two EFA regions - East Asia and the Pacific, and Latin America and the Caribbean - are further divided into two sub-regions.

Composition of EFA regions
  • North America and Western Europe (26 countries and territories)
    Andorra, Austria, Belgium, Canada, Cyprus, Denmark, Finland, France, Germany, Greece, Iceland, Ireland, Israel, Italy, Luxembourg, Malta, Monaco, Netherlands, Norway, Portugal, San Marino, Spain, Sweden, Switzerland, United Kingdom, United States.
  • Central and Eastern Europe (21 countries)
    Albania, Belarus, Bosnia and Herzegovina, Bulgaria, Croatia, Czech Republic, Estonia, Hungary, Latvia, Lithuania, Montenegro, Poland, Republic of Moldova, Romania, Russian Federation, Serbia, Slovakia, Slovenia, The former Yugoslav Republic of Macedonia, Turkey, Ukraine.
  • Central Asia (9 countries)
    Armenia, Azerbaijan, Georgia, Kazakhstan, Kyrgyzstan, Mongolia, Tajikistan, Turkmenistan, Uzbekistan.
  • East Asia and the Pacific (33 countries and territories)
    East Asia (16 countries and territories)
    Brunei Darussalam, Cambodia, China, Democratic People's Republic of Korea, Indonesia, Japan, Lao People's Democratic Republic, Macao (China), Malaysia, Myanmar, Philippines, Republic of Korea, Singapore, Thailand, Timor-Leste, Viet Nam.
    Pacific (17 countries and territories)
    Australia, Cook Islands, Fiji, Kiribati, Marshall Islands, Micronesia (Federated States of), Nauru, New Zealand, Niue, Palau, Papua New Guinea, Samoa, Solomon Islands, Tokelau, Tonga, Tuvalu, Vanuatu.
  • South and West Asia (9 countries)
    Afghanistan, Bangladesh, Bhutan, India, Iran (Islamic Republic of), Maldives, Nepal, Pakistan, Sri Lanka.
  • Arab States (20 countries and territories)
    Algeria, Bahrain, Djibouti, Egypt, Iraq, Jordan, Kuwait, Lebanon, Libyan Arab Jamahiriya, Mauritania, Morocco, Occupied Palestinian Territory, Oman, Qatar, Saudi Arabia, Sudan, Syrian Arab Republic, Tunisia, United Arab Emirates, Yemen.
  • Sub-Saharan Africa (45 countries)
    Angola, Benin, Botswana, Burkina Faso, Burundi, Cameroon, Cape Verde, Central African Republic, Chad, Comoros, Congo, Côte d'Ivoire, Democratic Republic of the Congo, Equatorial Guinea, Eritrea, Ethiopia, Gabon, Gambia, Ghana, Guinea, Guinea-Bissau, Kenya, Lesotho, Liberia, Madagascar, Malawi, Mali, Mauritius, Mozambique, Namibia, Niger, Nigeria, Rwanda, Sao Tome and Principe, Senegal, Seychelles, Sierra Leone, Somalia, South Africa, Swaziland, Togo, Uganda, United Republic of Tanzania, Zambia, Zimbabwe.
  • Latin America and the Caribbean (41 countries and territories)
    Latin America
    (19 countries)
    Argentina, Bolivia (Plurinational State of), Brazil, Chile, Colombia, Costa Rica, Cuba, Dominican Republic, Ecuador, El Salvador, Guatemala, Honduras, Mexico, Nicaragua, Panama, Paraguay, Peru, Uruguay, Venezuela (Bolivarian Republic of).
    Caribbean
    (22 countries and territories)
    Anguilla, Antigua and Barbuda, Aruba, Bahamas, Barbados, Belize, Bermuda, British Virgin Islands, Cayman Islands, Dominica, Grenada, Guyana, Haiti, Jamaica, Montserrat, Netherlands Antilles, Saint Kitts and Nevis, Saint Lucia, Saint Vincent and the Grenadines, Suriname, Trinidad and Tobago, Turks and Caicos Islands.
References
  • UNESCO. 2011. EFA Global Monitoring Report 2011: The hidden crisis: Armed conflict and education. Paris: UNESCO. Annex, p. 269. (Download in PDF format, 6.4 MB)
  • UNESCO Institute for Statistics (UIS). 2010. Global education digest 2010: Comparing education statistics across the world. Montreal: UIS. Annex, p. 274-275. (Download in PDF format, 8 MB)
Related articles
External links
Friedrich Huebler, 26 March 2011, Creative Commons License
Permanent URL: http://huebler.blogspot.com/2011/03/efa.html

Primary school entrance age and duration

Education for All (EFA) and the Millennium Development Goals (MDG) both aim at universal primary education. All children worldwide should attend and complete primary school by 2015. However, national education systems differ and the meaning of primary education for all children therefore varies from country to country.

The UNESCO Institute for Statistics (UIS) maintains a database with the entrance age and duration of primary education for 204 countries and territories. Table 1 summarizes the distribution of primary school entrance ages from the UIS database. In nearly two thirds of all countries, children are expected to enter primary school when they are 6 years old. In a further third of countries, the entrance age is 5 or 7 years. Two countries have different primary school entrance ages, Ireland with 4 years and Mongolia with 8 years..

Table 1: Primary school entrance age
Age Countries Percent
4 years 1 0.5
5 years 29 14.2
6 years 126 61.8
7 years 47 23.0
8 years 1 0.5
Total 204 100.0
Source: UIS Data Centre, May 2010.

The geographic distribution of the entrance ages is shown in the map in Figure 1. 6 years is the common primary school start age in most of North and South America, Western Europe, Africa, the Arab States, and East Asia, with some exceptions. 7 years is more common in Eastern Europe, Central Asia, and parts of Sub-Saharan Africa. 7 years is also the primary school start age in some large countries: Brazil, China and Russia.

Figure 1: Primary school entrance age
World map with national primary school entrance ages
Source: UIS Data Centre, May 2010.

The duration of primary school, shown in Table 2, ranges from 3 to 8 years. In 126 of 204 countries and territories, primary school has a duration of 6 years. In about 25 countries each, the duration is 4, 5 or 7 years. The shortest duration, 3 years, is reported for Armenia, Russia and Turkmenistan. In Ireland, which has the earliest entrance age with 4 years, children have to attend primary school for 8 years.

Table 2: Primary school duration
Age Countries Percent
3 years31.5
4 years 26 12.8
5 years 23 11.3
6 years 126 61.8
7 years 25 12.3
8 years 1 0.5
Total 204 100.0
Source: UIS Data Centre, May 2010.

The map in Figure 2 illustrates the primary school duration by country. 6 years is the most frequent duration in North and South America, East Asia and the Pacific, the Arab States and most of Africa except for Southern Africa, where 7 years is the most common primary school duration. In Central and Eastern Europe, Central Asia, and South and West Asia, primary education is typically shorter, with a duration of 4 or 5 years.

Figure 2: Primary school duration
World map with national primary school duration
Source: UIS Data Centre, May 2010.

What are the implications of the different primary school entrance ages and durations for the MDG and EFA goal of universal primary education by 2015? The official duration of primary education is closely linked to the number of children out of school. As an example, assume that a country has a primary school duration of 5 years and that the number of children in and out of school is evenly distributed across the official primary school ages. Shortening the duration of primary school from 5 to 4 years would immediately reduce the number of children out of school by 20 percent. However, the primary school net enrollment rate, the official indicator for the MDG of universal primary education, would not change and the country would therefore not be closer to the 2015 goal.

Related articles
External links
Friedrich Huebler, 30 May 2010, Creative Commons License
Permanent URL: http://huebler.blogspot.com/2010/05/age.html

Pupil/teacher ratio in secondary school

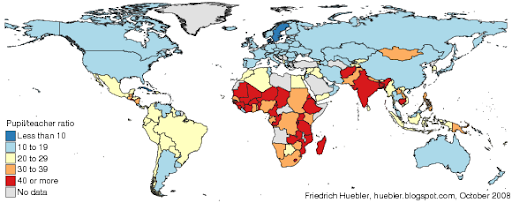
The pupil/teacher ratio is an indicator of education quality. In crowded classrooms with a high number of pupils per teacher the quality of education suffers. For pupils it is difficult to follow the course and teachers can dedicate less time to the needs of each individual student. Data from UNESCO on the pupil/teacher ratio in primary school show that crowded classrooms are more common in Sub-Saharan Africa and Southern Asia than in other parts of the world. 22 of the 27 countries with 40 or more pupils per primary school teacher are located in Sub-Saharan Africa.

In secondary school, pupil/teacher ratios are lower than in primary school. The Data Centre of the UNESCO Institute for Statistics provides the pupil/teacher ratio in secondary school for 189 countries and territories. For 100 countries, the pupil/teacher ratios are from 2006, 9 countries have data from 2007, 51 countries have data from 2004 or 2005, and the remaining 29 countries have data from 1999 to 2003. For the map below, all countries with data were divided into five groups:
  • Fewer than 10 pupils per teacher: 24 countries
  • 10 to 19 pupils per teacher: 107 countries
  • 20 to 29 pupils per teacher: 41 countries
  • 30 to 39 pupils per teacher: 13 countries
  • 40 or more pupils per teacher: 4 countries
Pupil/teacher ratio in secondary school, circa 2006
Map of the world showing national pupil/teacher ratios in secondary school
Data source: UNESCO Institute for Statistics, Data Centre, May 2008.

The lowest pupil/teacher ratios in secondary school were reported for Bermuda (6.0), Tokelau (7.0), Portugal (7.1), and Andorra (7.8). 20 additional countries have pupil/teacher ratios above 8 and below 10: Armenia, Azerbaijan, Belarus, British Virgin Islands, Cayman Islands, Croatia, Georgia, Greece, Kuwait, Lebanon, Liechtenstein, Lithuania, Malta, Monaco, Niue, Norway, Qatar, Russia, Sweden, and Turks and Caicos Islands.

More than half of all countries - including most countries in North and South America, Europe, the Middle East, and East Asia - have pupil/teacher ratios between 10 and 19. The group also includes some countries in other regions. Although pupil/teacher ratios in Sub-Saharan Africa are generally higher than in other parts of the world, the following countries from the region have only 10 to 19 pupils per secondary school teacher: Angola, Botswana, Burundi, Cameroon, Cape Verde, Comoros, Democratic Republic of Congo, Ghana, Guinea-Bissau, Mauritius, Seychelles, and Swaziland. 22 of the 41 countries with pupil/teacher ratios between 20 and 29 are also located in Sub-Saharan Africa.

17 countries have 30 or more pupils per teacher in secondary school and 10 of these countries are in Sub-Saharan Africa. The countries with 30 to 39 pupils per teacher are Chad, Congo, Djibouti, Honduras, India, Kenya, Mozambique, Myanmar, Nepal, Nicaragua, Philippines, South Africa, and Zambia. Classes at the secondary level of education are most crowded in Nigeria (pupil/teacher ratio 40.2), Pakistan (41.9), Malawi (45.6), and Eritrea (54.4).

The following table lists the average pupil/teacher ratio in secondary school by Millennium Development Goal region. The Commonwealth of Independent States (10.9), the developed countries (11.4), Oceania (14.8), Western Asia (15.3), Latin America and the Caribbean (16.6), Eastern Asia (19.0), and Northern Africa (19.0) have average pupil/teacher ratios below 20. Pupil/teacher ratios are highest in South-Eastern Asia (22.8), Sub-Saharan Africa (25.8), and Southern Asia (26.4). The global average is 18.0 pupils per teacher in secondary school. These average values are unweighted, which means that each country is given the same weight within its region, regardless of the size of its population.

Average pupil/teacher ratio in secondary school by MDG region, circa 2006
MDG region
Pupil/teacher ratio
Developed countries 11.4
Commonwealth of Independent States 10.9
Eastern Asia 19.0
South-Eastern Asia 22.8
Oceania 14.8
Southern Asia 26.4
Western Asia 15.3
Northern Africa 19.0
Sub-Saharan Africa 25.8
Latin America and the Caribbean 16.6
World 18.0
Data source: UNESCO Institute for Statistics, Data Centre, May 2008. Regional and global averages are unweighted.

The data analyzed in this article can be downloaded from the UNESCO Institute for Statistics Data Centre, under Predefined Tables - Education - Table 11: Indicators on teaching staff at ISCED levels 0 to 3.

Related articles
External links
Friedrich Huebler, 16 November 2008, Creative Commons License
Permanent URL: http://huebler.blogspot.com/2008/11/ptr.html

Pupil/teacher ratio in primary school

Global primary school attendance rates have been on a steady upward trend over the past years. As the world moves closer to the goal of universal primary education, the issue of education quality attracts increasing attention. One measure of education quality is the pupil/teacher ratio, the number of pupils per teacher in a school. Teachers of a large class can dedicate less time to each pupil than in a small class. For the pupils, crowded classrooms make it difficult to concentrate on the material and to learn. The results of overcrowding are lower academic achievement and increased dropout rates.

The map below displays the pupil/teacher ratio in primary school in 194 countries and territories for which data were available. The data were obtained from the UNESCO Institute for Statistics. For 124 countries, the pupil/teacher ratios are from 2006, 12 countries have data from 2007, 42 countries have data from 2004 or 2005, and the remaining 16 countries have data from 1999 to 2003. For the map, all countries were divided into five groups:
  • Fewer than 10 pupils per teacher: 7 countries
  • 10 to 19 pupils per teacher: 90 countries
  • 20 to 29 pupils per teacher: 43 countries
  • 30 to 39 pupils per teacher: 27 countries
  • 40 or more pupils per teacher: 27 countries
Pupil/teacher ratio in primary school, circa 2006
Map of the world showing national pupil/teacher ratios in primary school
Data source: UNESCO Institute for Statistics, Data Centre, May 2008.

The lowest pupil/teacher ratios in primary school were observed in Tokelau (5.8), San Marino (6.3), Bermuda (8.3), Liechtenstein (8.4), Denmark (9.9), and Sweden and Cuba (10.0). Most developed countries, countries in Eastern Europe and former members states of the Soviet Union have pupil/teacher ratios between 10 and 19. Some countries in East and South-East Asia, the Middle East, Africa, and Latin America also belong to this group, among them China, the world's most populous country, with a pupil/teacher ratio of 18.3. The majority of countries in Latin America, as well as some countries in Africa and Asia, have pupil/teacher ratios between 20 and 29.

Pupil/teacher ratios above 30 are common in Sub-Saharan Africa and South Asia. In 11 countries, primary school teachers have more than 50 pupils on average: Afghanistan (83.4), Mozambique (67.4), Rwanda (65.9), Chad (63.2), Mali (55.6), Congo (54.8), Burundi (54.2), Tanzania (53.1), Zambia (51.2), Bangladesh (50.9), and Cambodia (50.4). 22 of the 27 countries with 40 or more pupils per teacher are located in Sub-Saharan Africa.

The following table lists the average pupil/teacher ratio in primary school by Millennium Development Goal region. The highest pupil/teacher ratios exist in Sub-Saharan Africa (40.7) and Southern Asia (37.8). In contrast, the average pupil/teacher ratio in the developed countries is 13.7. In Western Asia (17.8), the Commonwealth of Independent States (17.9), and Oceania (19.8), the average pupil/teacher ratio is also below 20. The global average is 24.6 pupils per teacher in primary school. All regional and global averages are not weighted the population of each country; instead, each country is given the same weight within its region, regardless of the size of its population.

Pupil/teacher ratio in primary school by MDG region, circa 2006
MDG region
Pupil/teacher ratio
Developed countries 13.7
Commonwealth of Independent States 17.9
Eastern Asia 23.4
South-Eastern Asia 26.5
Oceania 19.8
Southern Asia 37.8
Western Asia 17.8
Northern Africa 24.4
Sub-Saharan Africa 40.7
Latin America and the Caribbean 21.3
World 24.6
Data source: UNESCO Institute for Statistics, Data Centre, May 2008. Regional and global averages are unweighted.

The data analyzed in this article can be downloaded from the UNESCO Institute for Statistics Data Centre, under Predefined Tables - Education - Table 11: Indicators on teaching staff at ISCED levels 0 to 3.

Related articles
External links
Friedrich Huebler, 26 October 2008 (edited 16 November 2006), Creative Commons License
Permanent URL: http://huebler.blogspot.com/2008/10/ptr.html

Adult literacy in 2007

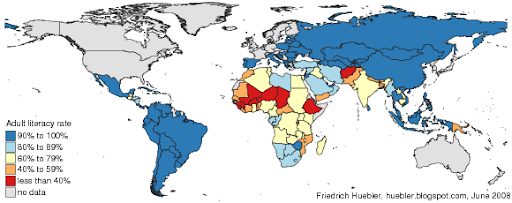
The release of new literacy data by the UNESCO Institute for Statistics (UIS) in May 2008 provides an opportunity to update an article on adult literacy rates that was published on this site in July 2007. The adult literacy rate is the share of literate persons in the population aged 15 years and older. Compared to the previous analysis, literacy data for more countries and for more recent years is available. An article on literacy data from the UIS provides additional information on the latest UIS database.

Before the update of May, the UIS database contained adult literacy rates for 136 countries and territories. For 10 countries, the most recent data was from 2005, for 30 countries from 2004, and for 5 countries from 2003. The remaining countries had data from 2002 or earlier years.

The UIS Data Centre now offers the adult literacy rate for 145 countries and territories. For 115 countries, data from 2007 is available. The map below displays the adult literacy rate for all countries with data.

Adult literacy rates by country, 2007
World map with adult literacy rates by country in 2007
Source: UNESCO Institute for Statistics, Data Centre, May 2008

The unweighted mean of the adult literacy rate is 81.2 percent. In 71 countries - including most of Eastern Europe, East and Southeast Asia, and Latin America - 90 percent or more of the adult population can read and write. The highest adult literacy rate, 99.8 percent, is reported for Cuba, Estonia and Latvia. Most countries without data are in the group of industrialized countries, where literacy rates are also likely to be above 90 percent. In 23 countries, the adult literacy rate is between 80 and 90 percent.

At the other extreme are eight countries with literacy rates below 40 percent: Mali (23.3), Chad (25.7), Afghanistan (28.0), Burkina Faso (28.7), Guinea (29.5), Niger (30.4), Ethiopia (35.9), and Sierra Leone (38.1). Another 16 countries have literacy rates between 40 and 60 percent: Benin (40.5), Senegal (42.6), Mozambique (44.4), Central African Republic (48.6), Cote d'Ivoire (48.7), Togo (53.2), Bangladesh (53.5), Pakistan (54.9), Liberia (55.5), Morocco (55.6), Bhutan (55.6), Mauritania (55.8), Nepal (56.5), Papua New Guinea (57.8), Yemen (58.9), and Burundi (59.3). Almost all of these countries are in Sub-Saharan Africa and South Asia.

Finally, the world's two largest countries in terms of population have very different literacy rates. In China, the adult literacy rate is 93.3 percent. In India, only 66 percent of the adult population can read and write.

The complete dataset with adult and youth literacy rates is available at the UIS Data Centre.

Related articles
External links
Friedrich Huebler, 15 June 2008, Creative Commons License
Permanent URL: http://huebler.blogspot.com/2008/06/adult-literacy.html

Survival rate to the last grade of primary school

Since January 2008, the survival rate to the last grade of primary school is an official indicator to track progress toward the second UN Millennium Development Goal (MDG), which calls for universal primary education by the year 2015. The survival rate to the last grade is the percentage of a cohort of students who enter the first grade of primary education and who are expected to reach the last grade, regardless of repetition.

As an example, assume that primary school has four grades. Assume further that 100 children enter grade one and that 5 of these children drop out from school before they reach the last grade. The remaining 95 children reach grade four, with or without repeating one or more grades. In this case, the survival rate to the last grade is 95 / 100 = 95%.

As a previous article on this site explains, the survival rate to grade five was used an official indicator for MDG 2 until 2007. The survival rate to the last grade is a better indicator because it can be calculated for countries with fewer than five grades of primary school and because it is more in line with the goal of universal primary education.

The map below shows the most recent statistics on the survival rate to the last grade from the UNESCO Institute for Statistics (UIS). In most cases, the statistics are from the year 2005. The next revision of the UIS database, expected in mid-2008, will contain survival rates for 2006.

Survival rate to the last grade of primary school, 2005
Map of the world showing national survival rates to the last grade of primary school, 2005
Data source: UNESCO Institute for Statistics, Data Centre, January 2008.

The current UIS database lists the survival rate to the last grade for 154 countries. The values range from 25% in Nauru and Uganda to 100% in Croatia, Cyprus, Iceland, Israel, Italy, Norway, Spain, and Tajikistan. In addition to Nauru and Uganda, nine other countries have survival rates below 50%: Chad (26%), Rwanda (31%), Equatorial Guinea (33%), Malawi (34%), Mauritania (39%), Madagascar (43%), Turks and Caicos Islands (45%), and Benin and Mozambique (46%). In these eleven countries, more than half of all children who start attending primary school drop out before they reach the last grade.

Ten countries have survival rates in the range 50-60%, 20 each are in the range 60-70% and 70-80%, 26 countries have survival rates from 80% to 90%, and in 67 countries 90% or more of all primary school entrants reach the last grade. As the map shows, almost all countries with survival rates below 60% are located in Sub-Saharan Africa.

The following table compares average survival rates in the different MDG regions. In the group of developed countries, in the countries from the Commonwealth of Independent States (former Soviet Republics), and in Eastern Asia, almost all children reach the last grade of primary school. In contrast, fewer than two thirds of all first grade students in Sub-Saharan Africa reach the last grade. Survival rates are also relatively low in Northern Africa and Oceania (78%), and in Southern and South-Eastern Asia (84%). In Western Asia and Latin America, around 90% of all first grade students reach the last grade.

Survival rate to the last grade of primary school, 2005
MDG region Survival rate to last grade (%)
Male FemaleTotal
Developed countries 99.199.299.2
Commonwealth of Independent States99.699.099.4
Eastern Asia98.998.898.8
South-Eastern Asia84.584.384.4
Oceania78.478.278.3
Southern Asia84.583.083.8
Western Asia88.786.988.0
Northern Africa75.381.878.3
Sub-Saharan Africa64.363.163.9
Latin America and the Caribbean90.590.190.4
World85.184.584.9
Data source: UNESCO Institute for Statistics, Data Centre, January 2008.

The average survival rate to the last grade at the global level is 85%, with virtually no difference between boys and girls. However, gender disparities exist in some regions, in particular in Northern Africa, were girls, with an average survival rate of 82%, are more likely to continue their education to the last grade of primary school than boys, whose survival rate is 75%.

Related articles
External links
Friedrich Huebler, 11 February 2008, Creative Commons License
Permanent URL: http://huebler.blogspot.com/2008/02/survival-rate-to-last-grade-of-primary.html